[1]
B. Bevis and D. Hull: Craze distribution around cracks in polystyrene, Inter. Jour. of Mater. Sciences Vol. 5 (1970), p.983.
DOI: 10.1007/bf00558180
Google Scholar
[2]
A. Chudnovsky, I. Palley and E. Baer: Thermodynamics of the quasiequilibrial growth of crazes, Inter. Jour. of Mater. Science, Vol. 16 (1981), p.35.
DOI: 10.1007/bf00552056
Google Scholar
[3]
D. Post, Proceedings of Society for Experimental Stress Analysis 12, p.99 (1954).
Google Scholar
[4]
J. Botsis, A. Chudnovsky and A. Moet: Fatigue crack layer propagation in polystyrene, Inter. Jour. of Fracture, Parts I and II, Vol. 33 (1987), p.263.
DOI: 10.1007/bf00044415
Google Scholar
[5]
M. Chabaat: Comparison of minimal principal stress trajectories with craze distribution in an amorphous polymer, Inter. Jour. of Fracture, Vol. 37 (1988), p.47.
DOI: 10.1007/bf00032536
Google Scholar
[6]
N. Tada, P. C. Paris and G. R. Irwin, The Stress Analysis of Cracks Handbook, Del Research Corporation, Hellertown, PA (1973).
Google Scholar
[7]
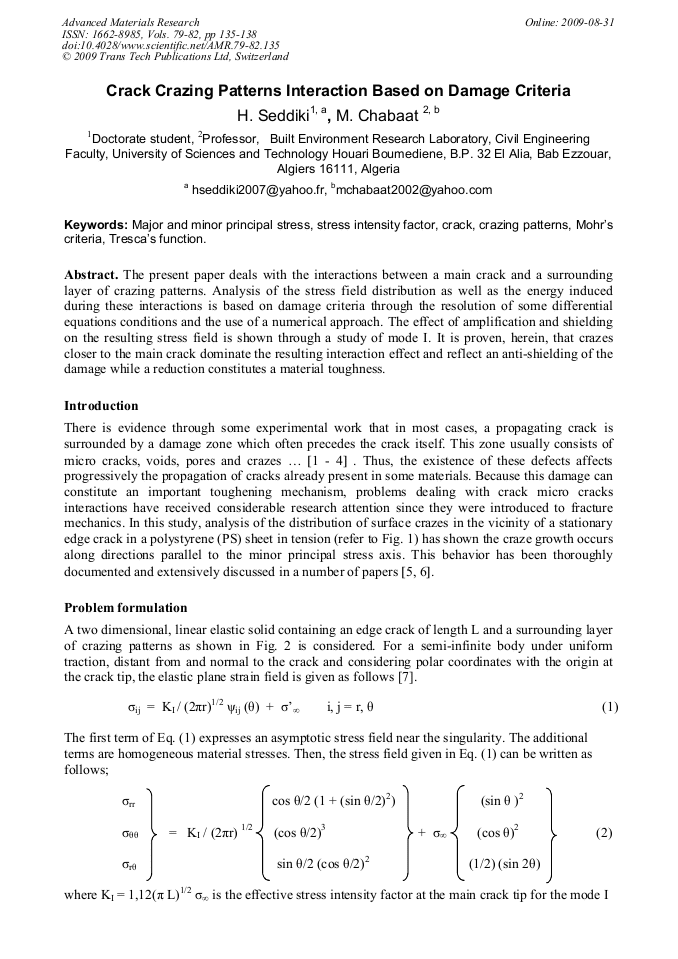
Chabaat M., Djouder S. and Touati M., Semi-Empirical stress analysis of a brittle material in a vicinity of a stress concentrator, Inter. Jour. of Appl. Mech. and Mater., Vol. 3-4, PP 243 - 252, (2005).
DOI: 10.4028/www.scientific.net/amm.3-4.243
Google Scholar
[8]
Demailly J. P., Analyse numérique et équations différentielles, Presses Universitaires de Grenoble (1996).
Google Scholar
[20]
[20] [20] [40] [40] [60] [60] [80] 80100120140 160180 -3 -2. 5 -2 -1. 5 -1 -0. 5 0. 5.
Google Scholar
[3]
x 10 -3 500 500 500 500 1000 1000 1000 1500 1500 1500 1500 2000 2000 20002500 2500 2500 3000 3000 3500 3500 4000 -0. 5 0 0. 5 1 1. 5 2 2. 5 0. 2 0. 4 0. 6 0. 8.
DOI: 10.1163/9789004341241_005
Google Scholar
[1]
1. 2 1. 4 1. 6 1. 8.
Google Scholar
[2]
x 10 -5 200 200 200 200 400 400 400 600 600 600 800 800 800 1000 1000 1000 1200 1200 1200 1400 1400 1400 1600 1600 1800 1800 2000 -3 -2. 5 -2 -1. 5 -1 -0. 5 0.
DOI: 10.2307/2004894
Google Scholar
[1]
[2] [3] [4] [5] [6] [7] [8] [9] [10] x 10 -5 200 200 400 400 600 8001000 0. 5 1 1. 5 2 2. 5 3.
Google Scholar
[1]
[2] [3] [4] [5] [6] [7] [8] [9] [10] x 10 -5 Figure 4: Variation of the reduced major principal stress Σ1 for r ∈ V(0) function of the orientation of the crazing patterns θ and the position of crazing patterns. Figure 5: Variation of the reduced minor principal stress Σ2 for r ∈ V(0) function of the orientation of the crazing patterns θ and the position of crazing patterns.
DOI: 10.4028/www.scientific.net/kem.345-346.1617
Google Scholar
[20]
[20] 20 (2020).
Google Scholar
[40]
[40] 4040.
Google Scholar
[40]
[60] 60.
Google Scholar
[60]
[60] [60] [60] 60.
Google Scholar
[60]
8080 80 8080.
Google Scholar
[80]
[80] [80] 80 100100 100100 100 100 100 100 100 120 120 120 120 120120 140 140 140 160 160 180 Sigma3p -3 -2. 5 -2 -1. 5 -1 -0. 5 0. 4 0. 6 0. 8.
Google Scholar
[1]
1. 2 1. 4 1. 6 1. 8.
Google Scholar
[2]
x 10-5 100 100100 100 100 100 200 200200 200 200200 300 300300 300 300 300 300 400 400 400 400 400 400 400 400 400 500 500 500 500 500 500 500 600 600 600 600 600600 600 700 700 700700 700 700 800 800 800 900900 1000 1000 0. 5 1 1. 5 2 2. 5.
DOI: 10.1515/9783112460825-001
Google Scholar
[1]
[2] [3] [4] [5] [6] [7] [8] x 10 -7 -700000 -600000 -500000 -500000 -400000 -400000-400000 -400000 -300000 -300000 -300000-300000 -300000 -200000 -200000 -200000-200000 -200000 -200000 -200000 -100000 -100000 -100000 -100000 -100000 -100000 -100000 -100000 -100000.
DOI: 10.5474/egeologija.202203101
Google Scholar
0 -3 -2. 5 -2 -1. 5 -1 -0. 5 0.
Google Scholar
[2]
[4] [6] [8] [10] [12] x 10 -6 50000 50000 50000 50000 50000 50000 5000050000 50000 50000 50000 50000 50000 100000 100000 100000 100000 100000100000 100000 150000 150000 150000 200000 200000 200000 250000 250000250000 250000 300000 300000 300000350000 350000 350000400000 0. 5 1 1. 5 2 2. 5 3 0. 5.
DOI: 10.1201/9780203998205-52
Google Scholar
[3]
3. 5 x 10⁻⁵ Figure 6: Variation of the reduced principal stress Σ3 for r ∈ V(0) function of the orientation of the crazing patterns θ and the position of crazing patterns Figure 7: Variation of the reduced maximum shear stress function relative to the applied stress. Σ12 for r ∈ V(0) function of the orientation of the crazing patterns θ and the position of crazing patterns. 200 200 200 200 400 400 400 600 600 800 800 1000 1000 12001400 16001800 -3 -2. 5 -2 -1. 5 -1 -0. 5 0.
DOI: 10.4028/www.scientific.net/kem.345-346.1617
Google Scholar
[1]
[2] [3] [4] [5] [6] [7] x 10 -6 500 500 500 500 1000 1000 1000 10001000 1500 1500 1500 2000 20002500 0. 5 1 1. 5 2 2. 5 3.
DOI: 10.1017/9781108863612.006
Google Scholar
[2]
[4] [6] [8] [10] [12] [14] [16] x 10 -7.
Google Scholar
[50]
[50] 50 100 150 200 250 -3 -2. 5 -2 -1. 5 -1 -0. 5 0 0. 5.
Google Scholar
[1]
[2] [3] [4] [5] [6] [7] [8] [9] [10] x 10 -5 1000 1000 1000 2000 2000 2000 2000 3000 3000 3000 4000 4000 4000 5000 5000 5000 6000 6000 7000 7000 8000 0. 5 1 1. 5 2 2. 5 3.
DOI: 10.31003/uspnf_r5970_01_01
Google Scholar
[1]
[2] [3] [4] [5] [6] [7] [8] [9] [10] x 10 -8 Figure 8: Variation of the reduced maximum shear stress function relative to the applied stress. Σ13 for r ∈ V(0) function of the orientation of the crazing patterns θ and the position of crazing patterns. Figure 9: Variation of the reduced maximum shear stress function relative to the applied stress. Σ23 for r ∈ V(0) function of the orientation of the crazing patterns θ and the position of crazing patterns. r (mm) θ (rad) r (mm) θ (rad) r (mm) θ (rad) r (mm) θ (rad) r (mm) θ (rad) r (mm) θ (rad) r (mm) θ (rad) r (mm) θ (rad) r (mm) θ (rad) r (mm) θ (rad) r (mm) θ (rad) r (mm) θ (rad).
DOI: 10.1615/telecomradeng.v63.i2.40
Google Scholar