p.1187
p.1193
p.1199
p.1203
p.1208
p.1211
p.1217
p.1223
p.1229
Fast Visualization Programming of Ocean Remote Sensing Information Based on IDL

Abstract:
The most commonly used method for ocean information visualization is plotting two-dimensional distribution images by using the IDLgrContour object in IDL,But when the data volume exceeds 10M, it process looks like rolling window curtains.Draw on the experience of contour display type,here we put forward the application technique of efficient visualization of large data sets,include basic framework,colorbar configuration and realizing process.The example shows it can meet the fast display requirement of common ocean remote sensing information with excellent expansibility and flexibility.

Info:
Periodical:
Pages:
1208-1210
Citation:
Online since:
January 2011
Authors:
Keywords:
Price:
Сopyright:
© 2011 Trans Tech Publications Ltd. All Rights Reserved
Share:
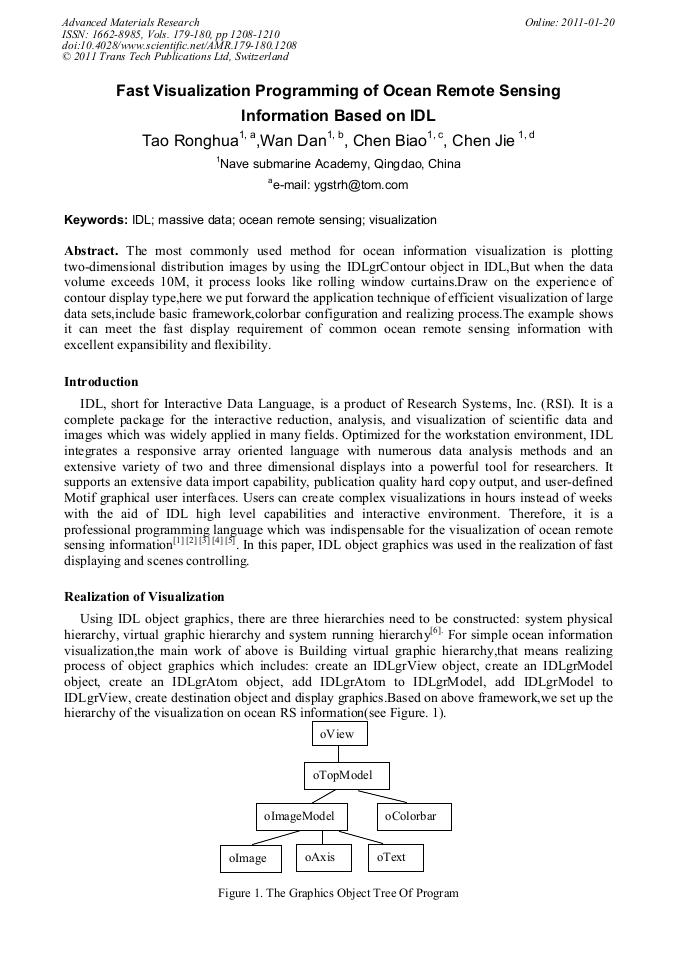
Citation: